Our system will evaluate the answer based on this AI-generated description.
The image depicts a bar chart showing the number of houses built per year in the cities of Derby and Nottingham from the year 2000 to 2009; Derby houses are represented in blue and Nottingham in yellow. In 2000, 100 houses were built in Derby and 150 in Nottingham. In 2001, Derby had 150 and Nottingham 200. In 2002, numbers in Derby rose to 200, while Nottingham increased slightly to 250. In 2003, the numbers decreased for both cities, with Derby at 90 and Nottingham at 150. For 2004, Derby built 200 houses, and Nottingham constructed 300. The year 2005 had a steep decline for both, with Derby at 90 and Nottingham at 100. In 2006, Derby's constructions slightly grew to 140, and Nottingham's to 80. By 2007, Derby numbers remain unchanged, but Nottingham's decreased to 50. The numbers rose in 2008 dramatically, with Derby constructing 350 houses while Nottingham built 320. The chart concludes with 2009 data showing Derby at 90 houses and Nottingham at 350.
Given the complexity of the image, the above description may not be entirely accurate.
Skyrocket your IELTS band score by 1-2 points in under a month with our premium plan!
Note: Both the topic and the answer were created by one of our users.
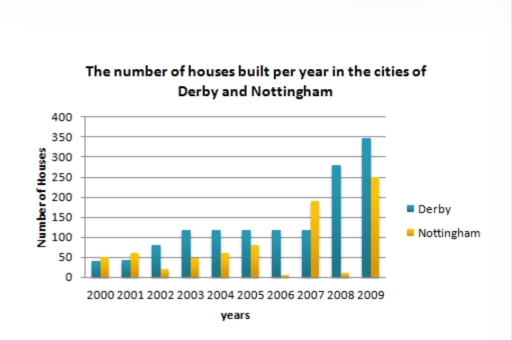
The bar graph compares the number of houses built annually in two cities over a ten-year period starting from 2000.
Overall, both cities experienced an upward trend in the number of houses built. Initially, Nottingham constructed more houses than Derby, but by the end of the period, Derby outpaced Nottingham in housing construction.
In 2000, Derby built approximately 50 new homes. This number rose steadily to about 125 homes by 2003 and remained stable until 2005. Subsequently, Derby experienced a dramatic increase, peaking at around 300 homes by the end of the period.
Nottingham, on the other hand, exhibited a more fluctuating pattern. From 2000 to 2005, the number of new homes built hovered around 50. However, in 2006, this number dropped sharply to nearly 0. A significant surge occurred in 2007, with about 200 new homes constructed. This was followed by another drop to almost 0 in 2008, before finally skyrocketing to 250 new homes by the end of the period.
In summary, despite initial differences and varying patterns of growth, both cities saw an overall increase in the number of houses built over the ten-year period, with Derby ultimately leading in housing construction by the end of the timeframe.
Word Count: 201