Our system will evaluate the answer based on this AI-generated description.
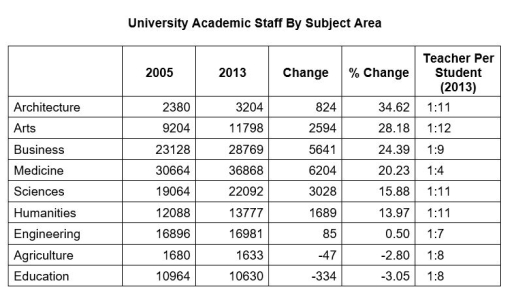
The image shows a table titled "University Academic Staff By Subject Area" with columns for 2005, 2013, Change, % Change, and Teacher Per Student (2013). Architecture had 2380 staff in 2005, 3204 in 2013, a change of 824, % change of 34.62, and teacher per student ratio of 1:11. Arts had 9204 staff in 2005, 11798 in 2013, a change of 2594, % change of 28.18, and a ratio of 1:12. Business had 23128 staff in 2005, 28769 in 2013, a change of 5641, % change of 24.39, and a ratio of 1:9. Medicine had 30664 staff in 2005, 36868 in 2013, a change of 6204, % change of 20.23, and a ratio of 1:4. Sciences had 19064 staff in 2005, 22092 in 2013, a change of 3028, % change of 15.88, and a ratio of 1:11. Humanities had 12088 staff in 2005, 13777 in 2013, a change of 1689, % change of 13.97, and a ratio of 1:11. Engineering had 16896 staff in 2005, 16981 in 2013, a change of 85, % change of 0.50, and a ratio of 1:7. Agriculture had 1680 staff in 2005, 1633 in 2013, a change of -47, % change of -2.80, and a ratio of 1:8. Education had 10964 staff in 2005, 10630 in 2013, a change of -334, % change of -3.05, and a ratio of 1:8.
Given the complexity of the image, the above description may not be entirely accurate.
Skyrocket your IELTS band score by 1-2 points in under a month with our premium plan!
Note: Both the topic and the answer were created by one of our users.
The table compares the number of academic staff in various university subject areas in the years 2005 and 2013, along with the change in numbers, percentage change, and the teacher-to-student ratio in 2013.
Overall, most subject areas experienced an increase in academic staff over the period, with Medicine having the highest total number in both years, while Education was the only field to show a notable decline.
Between 2005 and 2013, Medicine had the largest absolute increase in staff, rising from 30,664 to 36,868, a growth of 6,204. Business and Arts also saw substantial increases, with staff numbers rising by 5,641 and 2,594 respectively. Architecture experienced the most significant percentage growth at 34.62%, despite having fewer overall staff than other fields.
In contrast, Education and Agriculture were the only subjects to see a decline, with Education dropping by 334 staff members and Agriculture by 47. Engineering showed minimal growth, increasing by just 85 personnel or 0.5%.
Word Count: 156
