🔥 Today Only: Save 30% on Premium — Offer Ends Soon! - Upgrade Now!
Multiple Graphs

Band 5+: the chart below shows the value of one country's exports in various categories during 2015 and 2016. The tablet shows the percentage change in each category of exports in 2016 compared with 2015. Summarize the information by selecting and reporting the main features, and make comparisons where relevant.

Image for topic: the chart below shows the value of one country's exports in various categories during 2015 and 2016. The tablet shows the percentage change in each category of exports in 2016 compared with 2015. Summarize the information by selecting and reporting the main features, and make comparisons where relevant.
Our system will evaluate the answer based on this AI-generated description.
The image displays export earnings data from 2015 to 2016 for five product categories: Petroleum products, Engineered goods, Gems and jewelry, Agricultural products, and Textiles. In 2015, Petroleum products earned approximately $61 billion, increasing to about $63 billion in 2016. Engineered goods rose from $58 billion in 2015 to around $61 billion in 2016. Gems and jewelry decreased from $43 billion in 2015 to approximately $41 billion in 2016. Agricultural products saw an increase from $31 billion in 2015 to about $32 billion in 2016. Textiles increased from $25 billion in 2015 to approximately $28 billion in 2016. The percentage change table shows: Petroleum products with a 3% increase, Engineered goods with an 8.5% increase, Gems and jewelry with a 5.18% decrease, Agricultural products with a 0.81% increase, and Textiles with a 15.24% increase.
Given the complexity of the image, the above description may not be entirely accurate.
Note: Both the topic and the answer were created by one of our users.

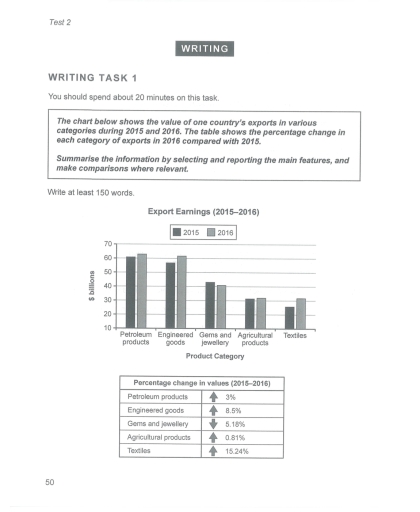
The images highlight the information about the value of one country’s export in different categories in the period of time from 2015 to 2016.Additionaly,the table depicts the proportion change in every sector of exports in 2016 compared with 2015

Overall,the most significant changes occurred in the Fabrics, while the lover figures were recorded in the Crops. In addition,decrease in percentage can be seen in precious stones and jewellery.

In comparison to the previous year, the number of the Textiles export has significantly increased from just under 30 billions to just over 31 billion.Meanwhile the rate of engineered goods also saw increase in yearly export income,from justs under 60 billions to 63 billions dollars,in addition the changes in percentage one of the most highest.

Regarding Gems and Jewellery, the figures show that the annual production income has decreased from just over 43 billion to almost 40 billion dollars.Moreover agricultural products rose quietly with just almost 1 percent.Additionally this area still has increased from 30 billion to 31 billion dollars in income.

Word Count: 170

Answers On The Same Topic:

the chart below shows the value of one country’s exports in various categories during 2015 and 2016. The tablet shows the percentage change in each category of exports in 2016 compared with 2015. Summarize the information by selecting and reporting the main features, and make comparisons where relevant.

The column chart shows how much money was made from exporting different products while the table provides the percentage changes in the value of these export goods in 2015 and 2016 in a particular country. In general, all export products increased in their value except for precious stones. Petroleum recorded the highest revenue while the […]

the chart below shows the value of one country’s exports in various categories during 2015 and 2016. The tablet shows the percentage change in each category of exports in 2016 compared with 2015. Summarize the information by selecting and reporting the main features, and make comparisons where relevant.

The bar chart shows the value of a country’s exports in different categories during 2015 and 2016. The table illustrates the percentage change over the same period. Overall, all products that the country exported increased in value, with the exception of gems and jewelry, which dropped in value. The most significant increases were recorded by […]

the chart below shows the value of one country’s exports in various categories during 2015 and 2016. The tablet shows the percentage change in each category of exports in 2016 compared with 2015. Summarize the information by selecting and reporting the main features, and make comparisons where relevant.

The bar chart compares a nation’s export values across sectors between 2015 and 2016, and the table provides the percentage changes in exports for each sector over the same period. Overall, export earnings increased for most sectors, with petroleum products consistently leading in export value across both years. The textiles sector experienced the most significant […]

the chart below shows the value of one country’s exports in various categories during 2015 and 2016. The tablet shows the percentage change in each category of exports in 2016 compared with 2015. Summarize the information by selecting and reporting the main features, and make comparisons where relevant.

the illustration demonstrates the index of one countrie’s exports in some categoriesnfrom 2015 to 2016. the table shows the proportion change in eacg section of exports in 2016 compares with 2016. over the period, the index of export of petrolium and agricultural products, engineered goods, textiles increased, while the figure for exporting gems and jeweller […]

the chart below shows the value of one country’s exports in various categories during 2015 and 2016. The tablet shows the percentage change in each category of exports in 2016 compared with 2015. Summarize the information by selecting and reporting the main features, and make comparisons where relevant.

The bar chart and table both compare the years 2015 and 2016, showing how much one country earned from exports and how this value changed in percentage. Evidently, except for precious stones, export earnings of all sectors trended upwards over the years, with textiles showing the greatest increase in percentage value. In addition, most of […]

See All

Other Topics:

5 type of export and export from USA TO UK

The table provides information about the top 5 USA exports in 2021 and the annual proportion change in 2020, while the bar chart illusatrt of the USA exports sent to the UK between 2010 to 2020. Overall, electric vehicles had the highest proportion, the smallest share taken by Petroleum, for the bar chart, in 2010 […]

The chart and table below show the results of a survey of library users at a university. Summarise the information by selecting and reporting the main features, and make comparisons where relevant.

The provided chart illustrates the results of a survey divided into categories of library users at a university, while the table shows the results of users’ satisfaction labeled by very satisfied, fairly satisfied or not satisfied. Overall, full-time undergraduates has an overwhelming majority of users with the percentage of slightly below than the half of […]

The pie chart below shows the average household expenditures in a country in 1950 and 2010. Write a report for a university lecturer describing the information below.

The pie charts provide information about the household spending in diverse categories on average in a country in the years 1950 and 2010. Overall, it is apparently evident that while housing accounted for most of the expenditure in 1950, other costs turned to become more important later. Another notable point is that a household spent […]

The pie chart below represents the main reasons why Agricultural land becomes less productive. The bar chart show how these causes affected three regions of the world in the 1990s. Summarise the data by selecting and reporting the main features and make comparisons where relevant.

The pie chart illustrate the main factors responsible for the decline in agriculture land productivity, while the bar chart compares the effects of these causes in North America, Europe and Oceania during the 1990s. Overall, over- grazing was the biggest cause of land degradation worldwide, whereas salinization was the smallest contributor. Europe had the highest […]

the pie chart below shows the average household ecpence in a country in 1950 and 2010.

The pie chart compares the average household expenditures in 1950 and 2010 in the country Overall, in 1950, housing was the most expensive, and the cost of health care was a small percentage. In 2010, all expenditures on essentials rose. The outcome of food was the largest, but also health care was the lowest. Housing […]

The chart and table below show the results of a survey of library users at a university. Summarise the information by selecting and reporting the main features, and make comparisons where relevant.

The chart and table demonstrate the outcomes of a survey of university’s library users. Overall, the most popular category of library users is the full-time undergraduate and the least popular is the academic staff. Furthermore, majority of library users are generally satisfied with all amenities in the library. to start with, full-time undergraduates comprise 44% […]

See All
We have detected unusual activity on your device.
Please verify your identity to continue.
Note: This verification step won't sign you in. If you have a premium account, please log in to access the service as usual.
Google/Gmail Verification
Or verify using Email/Code
We've sent a verification code to:
youremail@gmail.com (Not your email?)
Enter it below to complete the verification process.
Ensure your email address is correct, your inbox is not full, and you check your spam folder. If no email arrives, consider using an alternative email.
You will need a Premium plan to perform your action!
Note: If you already have a premium account, please log in to access our services as usual.

Plans & Pricing

Our mission is to make quality education accessible for everyone.
However, to keep our hardworking team running and this service alive, we genuinely need your support!
By opting for a premium plan, not only do you sustain us in achieving the mission, but you also unlock advanced features to enrich your learning experience.

Free

For learners who aren't pressed for time

What's included on Free
100+ Cambridge IELTS Tests
Instant IELTS Writing Task 1 & 2 Evaluation (2 times/month)
Instant IELTS Speaking Part 1, 2, & 3 Evaluation (5 times/month)
Instant IELTS Writing Task 1 & 2 Essay Generator (2 times/month)
500+ Dictation & Shadowing Exercises
100+ Pronunciation Exercises
Flashcards
Other Advanced Tools

Premium

For those serious about advancing their English proficiency, and for IELTS candidates aspiring to boost their band score by 1-2 points (especially in writing & speaking) in just 30 days or less

What's included on Premium
Save Your IELTS Test Progress
Unlock All Courses & IELTS Tests
Unlimited AI Conversations
Unlimited AI Writing Enhancement Exercises
Unlimited IELTS Writing Task 1 & 2 Evaluation
Unlimited IELTS Speaking Part 1, 2, & 3 Evaluation
Checked Answers Will Not Be Published
Unlimited IELTS Writing Task 1 & 2 Essay Generator
Unlimited IELTS Speaking Part 1, 2, & 3 Sample Generator
Unlimited Usage Of Advanced Tools
Priority Support within 24h (12-month plan only)

Due to the nature of our service and the provided free trials, payments are non-refundable.
Nếu bạn là người Việt Nam và không có hoặc không muốn trả bằng credit/debit cards, bạn có thể thanh toán bằng phương thức chuyển khoản:


Chọn gói:
419,000₫ 277,000 ₫ cho gói 1 tháng (chỉ 9,233₫/ngày)
1,239,000₫ 597,000 ₫ cho gói 3 tháng (chỉ 6,633₫/ngày)
2,469,000₫ 1,027,000 ₫ cho gói 6 tháng (chỉ 5,706₫/ngày)
4,929,000₫ 1,417,000 ₫ cho gói 12 tháng (chỉ 3,936₫/ngày)


Sau khi chuyển khoản, vui lòng đợi trình duyệt tự động điều hướng bạn trở lại Engnovate và bạn sẽ ngay lập tức nhận được mã kích hoạt tài khoản premium.
Nếu có lỗi xảy ra, bạn có thể liên hệ với team thông qua một trong các phương thức: email đến helloengnovate@gmail.com hoặc nhắn tin qua facebook.com/engnovate.
Vì toàn bộ công cụ trên website đều có thể sử dụng thử miễn phí, Engnovate không hỗ trợ hoàn tiền.