Our system will evaluate the answer based on this AI-generated description.
The image shows a line graph of 15 year-olds with low literacy levels from 2000 to 2009 for Austria, Denmark, Ireland, and Sweden. In 2000, Austria started at about 18%, Denmark at 16%, Ireland at 12%, and Sweden at 10%. In 2003, Austria increased to about 19%, Denmark stayed the same, Ireland increased to about 13%, and Sweden increased to about 11%. In 2006, Austria increased dramatically to about 27%, Denmark increased to about 17%, Ireland increased to about 15%, and Sweden increased to about 12%. In 2009, Austria decreased to about 26%, Denmark increased to about 18%, Ireland increased to about 17%, and Sweden increased to about 14%. The y-axis represents the percentage of 15 year-olds with low literacy levels, while the x-axis represents the years. Each country is represented by a different colored line: Austria (blue), Denmark (purple), Ireland (yellow), and Sweden (green).
Given the complexity of the image, the above description may not be entirely accurate.
Skyrocket your IELTS band score by 1-2 points in under a month with our premium plan!
Note: Both the topic and the answer were created by one of our users.
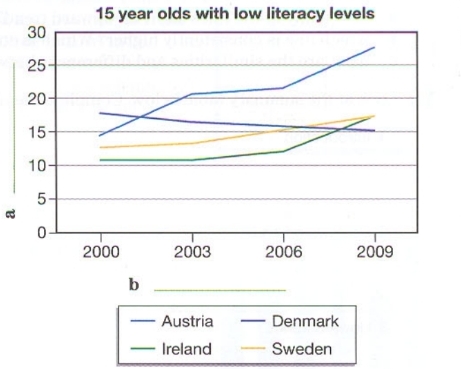
The line graph illustrates rates of teenagers (15 years old) with literacy problem in writing and reading in 4 countries from 2000 to 2009.
According to the graph, the only country with a converse trend is Denmark. It has a steady fall rate in percentage of adolescence poor literacy from about 17% in 2000 to about 15% in 2009.On the other hand, in other countries the rate is increasing. Austria has a markable trend among them, it has a sharp rise ,about 7%, from 2000 to 2009 and experienced a steady rise in the next 3 years. Then it increases again from 22% in 2000 to 28% in 2009 approximately. Ireland and Sweden climb very slowly over 9 years from just over 10% to 17% and 13% to 17% respectively.
Overal, with the exception of Denmark, other countries have an rising rate in 15 year olds with low literacy. Also, Austria has the biggest changes from 2000 to 2009, it is about 13%.
Word Count: 163