Our system will evaluate the answer based on this AI-generated description.
The image shows a line graph of 15 year-olds with low literacy levels from 2000 to 2009 for Austria, Denmark, Ireland, and Sweden. In 2000, Austria started at about 18%, Denmark at 16%, Ireland at 12%, and Sweden at 10%. In 2003, Austria increased to about 19%, Denmark stayed the same, Ireland increased to about 13%, and Sweden increased to about 11%. In 2006, Austria increased dramatically to about 27%, Denmark increased to about 17%, Ireland increased to about 15%, and Sweden increased to about 12%. In 2009, Austria decreased to about 26%, Denmark increased to about 18%, Ireland increased to about 17%, and Sweden increased to about 14%. The y-axis represents the percentage of 15 year-olds with low literacy levels, while the x-axis represents the years. Each country is represented by a different colored line: Austria (blue), Denmark (purple), Ireland (yellow), and Sweden (green).
Given the complexity of the image, the above description may not be entirely accurate.
Skyrocket your IELTS band score by 1-2 points in under a month with our premium plan!
Note: Both the topic and the answer were created by one of our users.
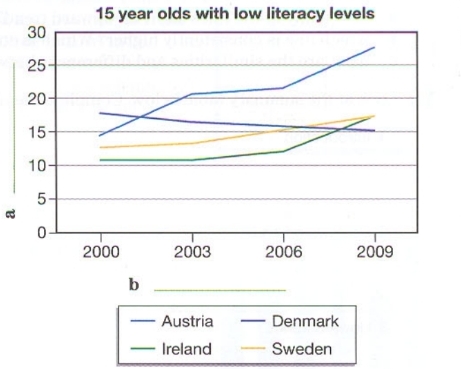
The graph compares the percentage of low literacy rates of 15 year olds in 4 European countries – Austria, Denmark, Sweden, and Ireland over a 9 year period of time between 2000 and 2009, measured in percent.
Overall, the percentage of poor literacy levels of teenagers in Austria, Sweden, and Ireland recorded a moderate increase, with Austria having the highest amount of bad literacy rates, whereas Denmark witnessed a slight decline. During 2000, Denmark had the highest number, but was overtaken by Austria at the end of the year.
In 2000, Denmark reported the highest percentage, approximately 17%, followed by Austria around 15%. On the contrary, Sweden accounted for low numbers at 12%, whereas Ireland showed the lowest percentage of 11%, which was 6% lower than Austria.
By 2009, Austria had improved significantly to 27%, reaching the highest number and replacing Denmark with a difference of 12%. Sweden and Ireland both followed a similar trend and reached the same percentage of 17%. In contrast, Denmark underwent a slight fall reaching around 15%. Ireland gained better growth than Sweden, which was about a 6% increase.
Word Count: 184