Our system will evaluate the answer based on this AI-generated description.
The image presents a line graph from 2000 to 2014 detailing numerical data for four entities: China, European Union, Asia (without China), and USA. In 2000, China starts at 8, European Union at 28, Asia (without China) at 26, and USA at 12. By 2002, China reaches 10, European Union at 26, Asia (without China) at 22, and USA at 11. In 2004, China's data moves to 15, European Union sits at 24, Asia (without China) at 19, and USA at 10. By 2006, China edges up to 19, European Union remains at 23, Asia (without China) remains steady at 19, and USA slightly lowers to 9. The 2008 data shows China at 23, European Union continuing at 23, Asia (without China) consistent at 19, USA at 9. In 2010, China advances to 27, European Union decreases to 21, Asia (without China) is steady at 19, and USA slightly dips to 8. By 2012, China records 32, European Union decreases to 20, Asia (without China) at 20, and USA charts 7. In 2014, China tops at 36, European Union stabilizes at 20, Asia (without China) at 21, and USA declines further to 6.
Given the complexity of the image, the above description may not be entirely accurate.
Skyrocket your IELTS band score by 1-2 points in under a month with our premium plan!
Note: Both the topic and the answer were created by one of our users.
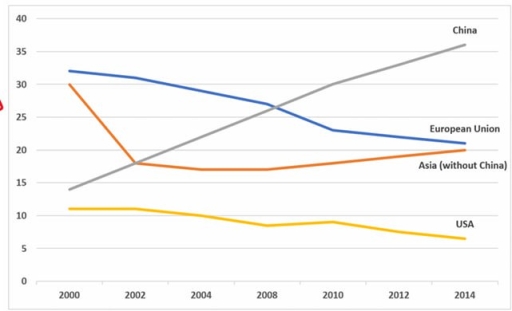
The line graph illustrates how much of clothing was exported in four different global unions between 2000 and 2014.
Overall, while the fastest growth was observed in Chinese exports over the period, other countries did not have as high volume of exports as China from 2008 to 2014.
Regarding Chinese, even though it started the period as the second least manufacturing country, making up under 15% in 2000, surpassing European Union in 2008, and ultimately reaching a peak of around 36% in 2014. For European Union, which dominated as the leading manufacturing union until 2008, accounting for approximately 33% initially. Despite the initial dominance, it kept decreasing by 2014 and reached nearly 21%.
As for the USA, it ended up demonstrating the smallest volume of exports from about 11% to about 6% throughout the period. In contrast, Asia began the period as the second dominant with roughly 30 percent; regardless, having undergone a rapid decline of almost 13%, it became the second least manufacturing continent by the end of the 2014.
Word Count: 171