🔥 Today Only: Save 30% on Premium — Offer Ends Soon! - Upgrade Now!
Table

Band 5+: The three pie charts below show changes in annual spending at a public school in Canada in 1990, 2000, and 2010. Summarise the information by selecting and reporting the main features, and make comparisons where relevant.

Image for topic: The three pie charts below show changes in annual spending at a public school in Canada in 1990, 2000, and 2010. Summarise the information by selecting and reporting the main features, and make comparisons where relevant.
Our system will evaluate the answer based on this AI-generated description.
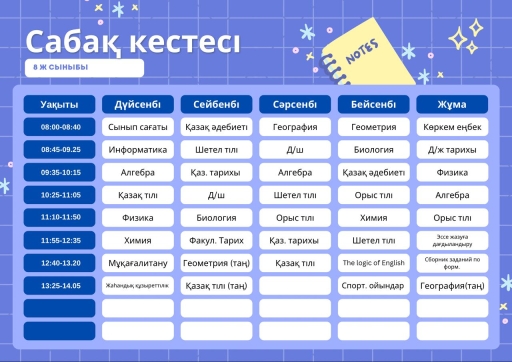
The image displays a school timetable titled "Сабақ кестесі" for "8 Ж СЫНЫБЫ". The schedule covers five days, with time slots from 08:00 to 14:05. Дүйсенбі (Monday) schedule: 08:00-08:40 Сынып сағаты, 08:45-09:25 Информатика, 09:35-10:15 Алгебра, 10:25-11:05 Қазақ тілі, 11:10-11:50 Физика, 11:55-12:35 Химия, 12:40-13:20 Мұқағалитану, 13:25-14:05 Жаһандық құзыреттілік. Сейсенбі (Tuesday) schedule: 08:00-08:40 Қазақ әдебиеті, 08:45-09:25 Шетел тілі, 09:35-10:15 Қаз. тарихы, 10:25-11:05 Д/ш, 11:10-11:50 Биология, 11:55-12:35 Факул. Тарих, 12:40-13:20 Геометрия (таң), 13:25-14:05 Қазақ тілі (таң). Сәрсенбі (Wednesday) schedule: 08:00-08:40 География, 08:45-09:25 Д/ш, 09:35-10:15 Алгебра, 10:25-11:05 Шетел тілі, 11:10-11:50 Орыс тілі, 11:55-12:35 Қаз. тарихы, 12:40-13:20 Қазақ тілі. Бейсенбі (Thursday) schedule: 08:00-08:40 Геометрия, 08:45-09:25 Биология, 09:35-10:15 Қазақ әдебиеті, 10:25-11:05 Орыс тілі, 11:10-11:50 Химия, 11:55-12:35 Шетел тілі, 12:40-13:20 The logic of English, 13:25-14:05 Спорт. ойындар. Жұма (Friday) schedule: 08:00-08:40 Көркем еңбек, 08:45-09:25 Д/ж тарихы, 09:35-10:15 Физика, 10:25-11:05 Алгебра, 11:10-11:50 Орыс тілі, 11:55-12:35 Эссе жазуға дайындандыру, 12:40-13:20 Сборник заданий по форм., 13:25-14:05 География(таң).
Given the complexity of the image, the above description may not be entirely accurate.
Note: Both the topic and the answer were created by one of our users.

The three pie charts illustrates how was budget in schools was shared across 5 categories in Canadian schools during the 1990,2000 and 2010

Overall,It is the immediately clear that it was shifted over the 2 decades,with other declining significantly to become less priority,while Facilities & Maintenance and Technology increased to take up the larger shares of 2010.

However,the Teacher’s salaries were the most shared in every decades, although the percentage of its category was decreasing.The significant fact is the learning resources were always neutralized, getting only 10%

By 1990,The Salaries were the most prioritised, getting 55%,while technology was the most unimportant factor with 5% and Facilities & Maintenance were getting popular.The second decade was the pretty similar to 1990, due to the fact that the incomes were dominating,but decreasing to 50%,the other also decreased in 3%.

The last decade is 2010, The Salaries decreased again in 5%,still staying at top, Facilities& Maintenance increased remarkably in 10% and technology 7%.Finally,the smallest proportion was dedicated to other, which fell slightly from 15% to 7% over the 20 years

Word Count: 176

Answers On The Same Topic:

The three pie charts below show changes in annual spending at a public school in Canada in 1990, 2000, and 2010. Summarise the information by selecting and reporting the main features, and make comparisons where relevant.

The three pie charts below visualize changes in yearly spending at a public school in Northern America (Canada) throughout the three given years 1900, 2000 and 2010. Overall, expenditure on teachers’ salaries had decreased, however, spending on facilities & maintenance had risen. Intriguingly, expenditure on learning resources, such as books, remained unchanged. At the beginning […]

The three pie charts below show changes in annual spending at a public school in Canada in 1990, 2000, and 2010. Summarise the information by selecting and reporting the main features, and make comparisons where relevant.

The three pie charts delineate average yearly expenditures at a public school in Canada between 1990, 2000, and 2010. Overall, teacher’s salaries contributed the largest expenditure, while spending on technology and facilities & maintenance distribution increased and expenditure on learning resources remained constant over the given period. From 1990, 2000, and 2010, teacher’s salaries had […]

The three pie charts below show changes in annual spending at a public school in Canada in 1990, 2000, and 2010. Summarise the information by selecting and reporting the main features, and make comparisons where relevant.

The three charts depict the changes in yearly spending by a private school in Canada in 1981, 1991, and 2001. Overall, teachers’ salaries accounted for the highest proportion in three decades, while technology accounted for roughly the lowest proportion, particularly over decades. In 1990, teachers’ salaries represented the largest share, approximately 55%, of the yearly […]

The three pie charts below show changes in annual spending at a public school in Canada in 1990, 2000, and 2010. Summarise the information by selecting and reporting the main features, and make comparisons where relevant.

The pie charts compare how a public school in Canada used its yearly expenditure over the period of 20 years, starting in 1990. Overall, there was an increase in the money spent for Facilities and Maintenance and Technology, while this fugure for staff salaries and other unspecified sectors decreased throughout the years. Moreover, teacher salaries […]

See All

Other Topics:

The table gives information on the expenditure rate of the government on education and training and participation rate of 18-24-year-olds in five nationas in 2002.

The table compares the proportion of government expenditure devoted to education and training with the participation of young adults aged 18-24 in five countries in 2002. Overall, Slovenia allocated by far the largest proportion of government expenditure for education and training, whereas Poland devoted the least. In terms of participation rate, however, Poland recorded the […]

The table gives information on the expenditure rate of the government on education and training and participation rate of 18-24-year-olds in five nationas in 2002.

The table compares the government spending on education and training and proportion of 18-24-year-olds participating in these activities in five European countries in 2002.Overall, it’s clear that all five countries had higher participation rates than expenditure rates. Moreover, Slovenia had the higher figures for both spending and participation, while Poland had the lowest expenditure rate […]

The chart below shows the sleep patterns of people in five different occupations according to a Canadian study. Write a report for a university lecturer, describing the information below. Give possible reasons for the differences. You should write at least 150 words.

The following table provides information about a group of individuals across five different careers: students, truck drivers, full-time mothers, business executives, and doctors, who experience varying sleep patterns according to a Canadian study. Overall, it is evident that undergraduates and business executives have the opportunity for uninterrupted sleep, while truck drivers, homemakers, and medical practitioners […]

The chart below shows the sleep patterns of people in five different occupations according to a Canadian study. Write a report for a university lecturer, describing the information below. Give possible reasons for the differences. You should write at least 150 words.

The following table gives information on a group of inhabitants in the five various careers including students, truck drivers, full-time mothers, business executives and doctors who spent their time in dormancy according to a Canadian research. Overall, it is clear that undergraduates and directors working in a business environment recorded an opportunity to have uninterrupted […]

The tables show results of two surveys done in 1980 and 2010 on various aspects of city living in a particular city. Units are measured in percentage.

The table illustrates the results of two surveys conducted about different living aspects of particular city. Overall, it is clear that education and healthcare were the highly ranked aspects of city in both years, while transport received the least positive opinions. Additionally, the public satisfaction decreased in all aspects, with the exception of education and […]

See All
We have detected unusual activity on your device.
Please verify your identity to continue.
Note: This verification step won't sign you in. If you have a premium account, please log in to access the service as usual.
Google/Gmail Verification
Or verify using Email/Code
We've sent a verification code to:
youremail@gmail.com (Not your email?)
Enter it below to complete the verification process.
Ensure your email address is correct, your inbox is not full, and you check your spam folder. If no email arrives, consider using an alternative email.
You will need a Premium plan to perform your action!
Note: If you already have a premium account, please log in to access our services as usual.

Plans & Pricing

Our mission is to make quality education accessible for everyone.
However, to keep our hardworking team running and this service alive, we genuinely need your support!
By opting for a premium plan, not only do you sustain us in achieving the mission, but you also unlock advanced features to enrich your learning experience.

Free

For learners who aren't pressed for time

What's included on Free
100+ Cambridge IELTS Tests
Instant IELTS Writing Task 1 & 2 Evaluation (2 times/month)
Instant IELTS Speaking Part 1, 2, & 3 Evaluation (5 times/month)
Instant IELTS Writing Task 1 & 2 Essay Generator (2 times/month)
500+ Dictation & Shadowing Exercises
100+ Pronunciation Exercises
Flashcards
Other Advanced Tools

Premium

For those serious about advancing their English proficiency, and for IELTS candidates aspiring to boost their band score by 1-2 points (especially in writing & speaking) in just 30 days or less

What's included on Premium
Save Your IELTS Test Progress
Unlock All Courses & IELTS Tests
Unlimited AI Conversations
Unlimited AI Writing Enhancement Exercises
Unlimited IELTS Writing Task 1 & 2 Evaluation
Unlimited IELTS Speaking Part 1, 2, & 3 Evaluation
Checked Answers Will Not Be Published
Unlimited IELTS Writing Task 1 & 2 Essay Generator
Unlimited IELTS Speaking Part 1, 2, & 3 Sample Generator
Unlimited Usage Of Advanced Tools
Priority Support within 24h (12-month plan only)

Due to the nature of our service and the provided free trials, payments are non-refundable.
Nếu bạn là người Việt Nam và không có hoặc không muốn trả bằng credit/debit cards, bạn có thể thanh toán bằng phương thức chuyển khoản:


Chọn gói:
419,000₫ 277,000 ₫ cho gói 1 tháng (chỉ 9,233₫/ngày)
1,239,000₫ 597,000 ₫ cho gói 3 tháng (chỉ 6,633₫/ngày)
2,469,000₫ 1,027,000 ₫ cho gói 6 tháng (chỉ 5,706₫/ngày)
4,929,000₫ 1,417,000 ₫ cho gói 12 tháng (chỉ 3,936₫/ngày)


Sau khi chuyển khoản, vui lòng đợi trình duyệt tự động điều hướng bạn trở lại Engnovate và bạn sẽ ngay lập tức nhận được mã kích hoạt tài khoản premium.
Nếu có lỗi xảy ra, bạn có thể liên hệ với team thông qua một trong các phương thức: email đến helloengnovate@gmail.com hoặc nhắn tin qua facebook.com/engnovate.
Vì toàn bộ công cụ trên website đều có thể sử dụng thử miễn phí, Engnovate không hỗ trợ hoàn tiền.