Our system will evaluate the answer based on this AI-generated description.
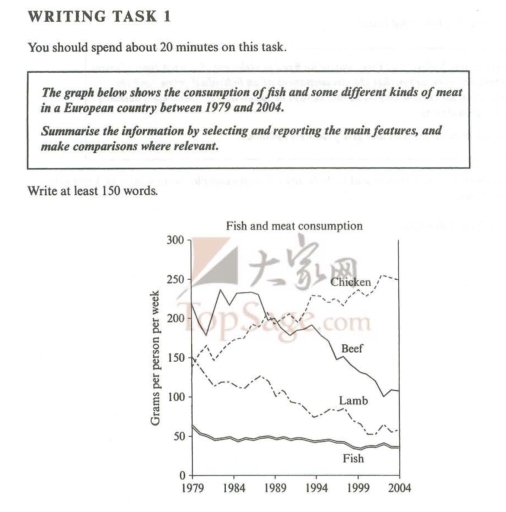
The image shows a line graph depicting the consumption of fish and different kinds of meat in a European country between 1979 and 2004, measured in grams per person per week. The x-axis represents the years, with intervals of 5 years from 1979 to 2004, while the y-axis measures the consumption from 0 to 300 grams, with intervals of 50 grams. The graph includes four lines representing Chicken, Beef, Lamb, and Fish, with each line showing an individual trend over the years. Chicken consumption started at just below 150 grams in 1979, steadily increased to just below 250 grams by 2004. Beef consumption fluctuated, starting at just above 200 grams in 1979, decreasing to just above 150 grams in 1999, and slightly increasing to just below 200 grams again by 2004. Lamb consumption showed a consistent decrease, starting at just below 150 grams in 1979 and ending at just above 50 grams in 2004. Fish consumption remained relatively stable, starting at just above 50 grams in 1979, reaching a peak at just below 100 grams in 1989, and fluctuating between 50 and 75 grams in the years following, ending at just below 50 grams in 2004.
Given the complexity of the image, the above description may not be entirely accurate.
Skyrocket your IELTS band score by 1-2 points in under a month with our premium plan!
Note: Both the topic and the answer were created by one of our users.
The following linear plot demonstrates the intake of Fish and other several types of Meat such as Beef, Chicken, Lamb, and Fish in an European nation in the middle of year 1979 and 2004.
Overall, It is clear from the diagram that initially Beef was the highly consumed product in Europe but Chicken overtook the Beef demand at the end of recording period and the rest of other products like Lamb and Fish got decreased from their initial demand.
According to the line graph, In the year 1979 Beef was highly ingested food numbered more than 200 grams per person per week but the proportion irregularly fluctuated at less than 150 grams in the year 2004. However, Chicken was slightly less than 150 at first but the grams per person per week for Chicken sky rocketed and peaked at 250 in the year 2004.
According to the line plot, In 1979 Lamb was at 150 grams per person per week but the number significantly dropped and held out below 100 grams over the time. Similarly, In 1979, Fish was a bit higher than 50 grams but later on it was substantially decreased and pointed at a small gap lower than 50 grams in 2004.
Word Count: 204
