Our system will evaluate the answer based on this AI-generated description.
The image shows a line graph titled 'Fish and Meat consumption' with the x-axis labeled with years from 1979 to 2004 in 5-year intervals and the y-axis labeled with 'Grams per person per week' starting from 0 to 300 in 50-gram increments. Four lines represent different types of meat: Fish (solid line), Lamb (dashed line), Beef (solid line), and Chicken (dashed line). Fish consumption starts at around 60 grams and shows a slight increase over the years, reaching just above 100 grams in 2004. Lamb consumption starts at approximately 150 grams, decreases steeply to around 75 grams by 1989, then levels off and fluctuates slightly. Beef consumption begins at 250 grams, declines steadily to almost 150 grams by 2004. Chicken consumption starts at nearly 150 grams, remains stable until 1989, then rises sharply, surpassing beef by 1999 and reaching just below 250 grams in 2004.
Given the complexity of the image, the above description may not be entirely accurate.
Skyrocket your IELTS band score by 1-2 points in under a month with our premium plan!
Note: Both the topic and the answer were created by one of our users.
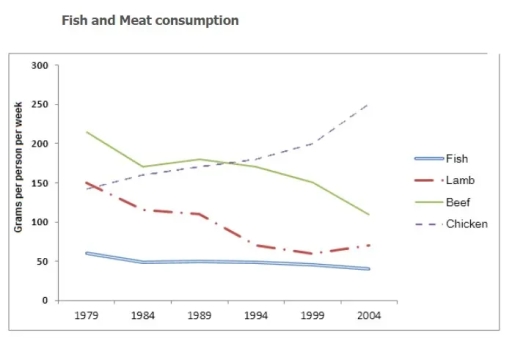
The presented line graph illustrates the divergent sorts of meat and also fish that were consumed over a European nation from 1979 to 2004.
At the onset, it is evident from the graph that chicken had experienced a significant rise throughout the period; simultaneously, the rest of them witnessed a decline.
As can be seen that chicken was the highest compared to others in these following years, increasing from beneath 150 to nearly 250 and it was reverse to the tendency of lamb which faced with downward trend at this point. Initially, it was just ahead of chicken, with under and above 150, respectively, however later on it fell down to around 100 in 2004.
We can notice that beef accounted for decrease. At the beginning period, it commenced with just over 200 although it declined by 180 in that year and than beef faced 240 alike as well as subsequently it declined stable until 2004 with 80. Turning to fish, there was not increase or anything like that. It almost remained steady with 60 except for some changes.
It is blatantly obvious that the gap between beef lamb in addition to fish had narrowed considerably over the second half of the period in question.
Word Count: 205